
Graphs
The debugger
The graph debugger is a view over the game while it plays: which graphs are loaded, what they are doing, and why they don't do what you meant. Press F7 in play to open and shut it (the key can be changed in the game's controls), or Escape to shut it.
It works offline, and on a host, never on a dedicated server: try the mod in the Test Map, or play any game with mods on. While it is shut nothing is traced and it costs nothing.
What it shows
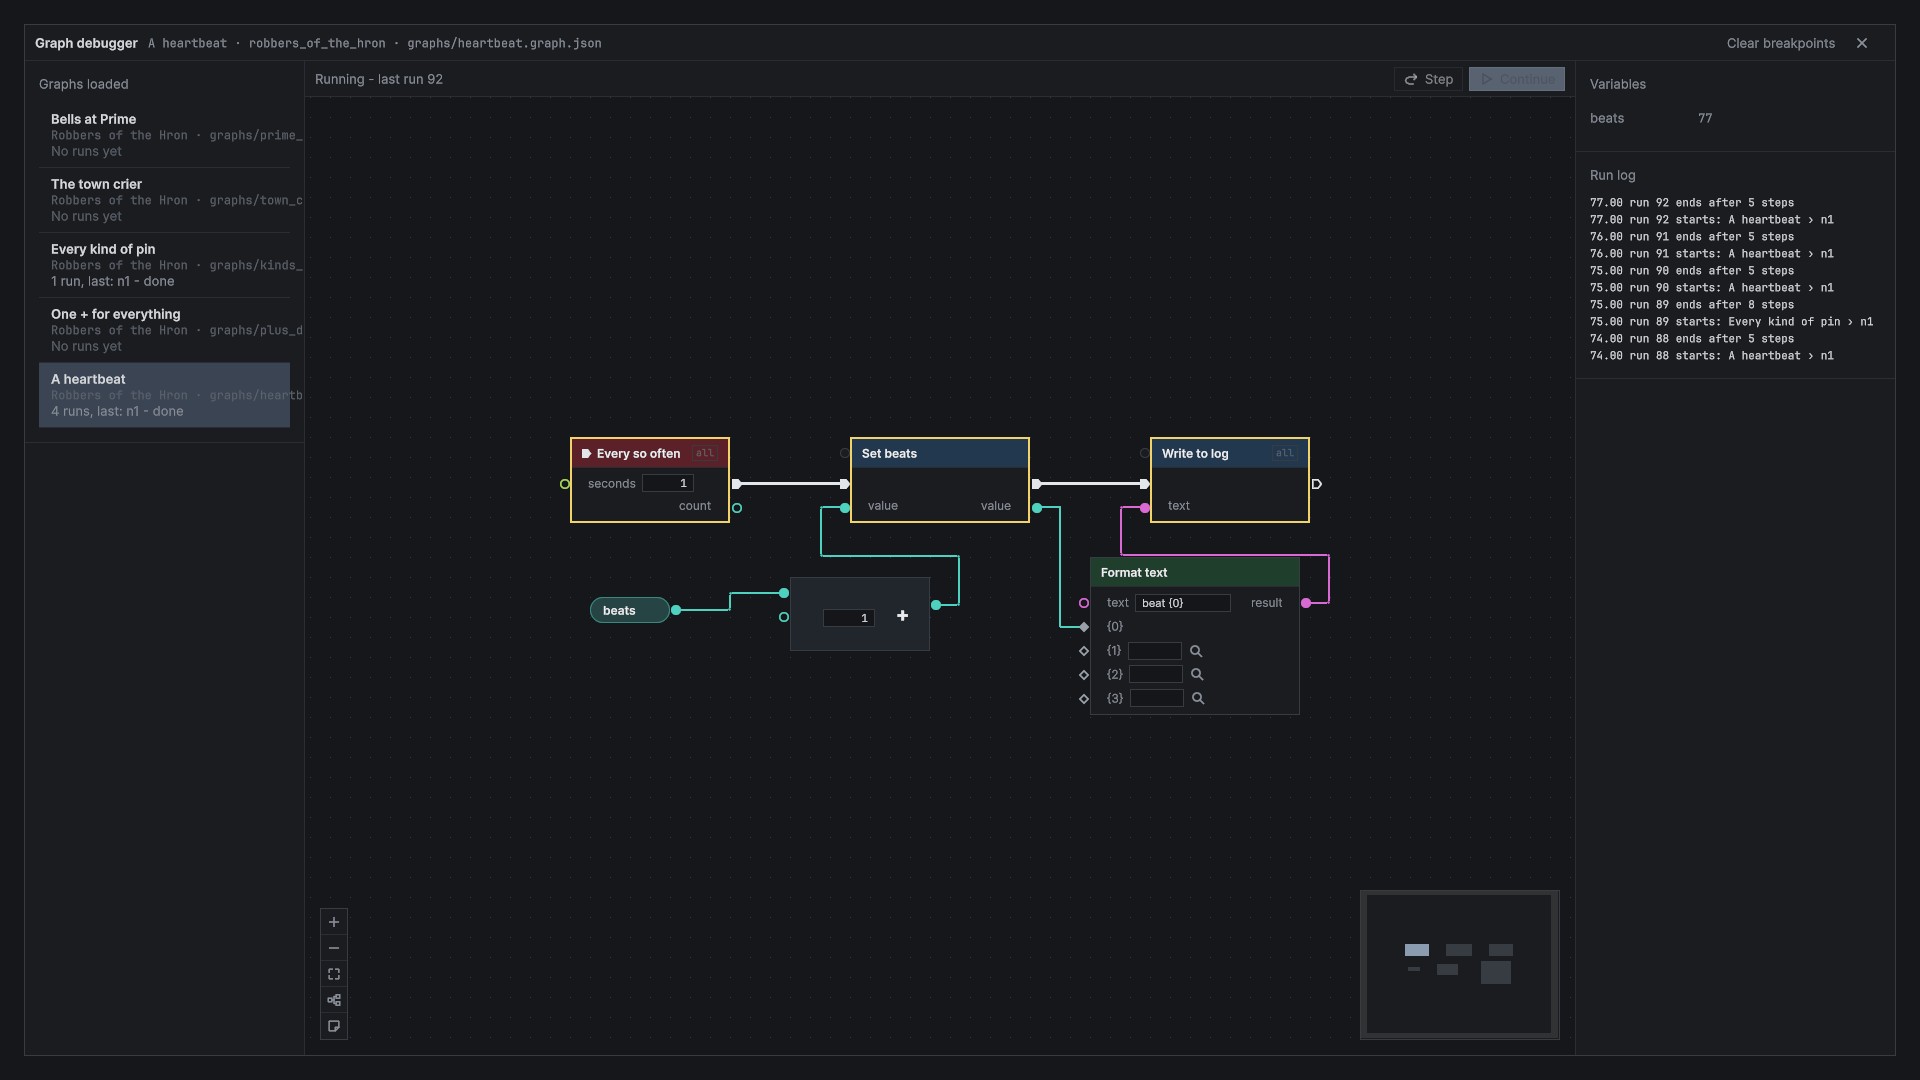
- On the left: the graphs loaded, each with its mod, its file, its last runs and its problems.
- In the middle: the picked graph, drawn read-only.
- Nodes light as they run and fade after a moment.
- Hovering a wire shows the last value that went along it.
- Hovering a variable's pill shows what it holds now.
- Double-clicking a function's call shows its body.
- On the right: the variables (a paused run's own, else as the last run left them, else as they start), and the run log: each run's start, its waits, its errors and its end, with how many steps it took.
Breakpoints
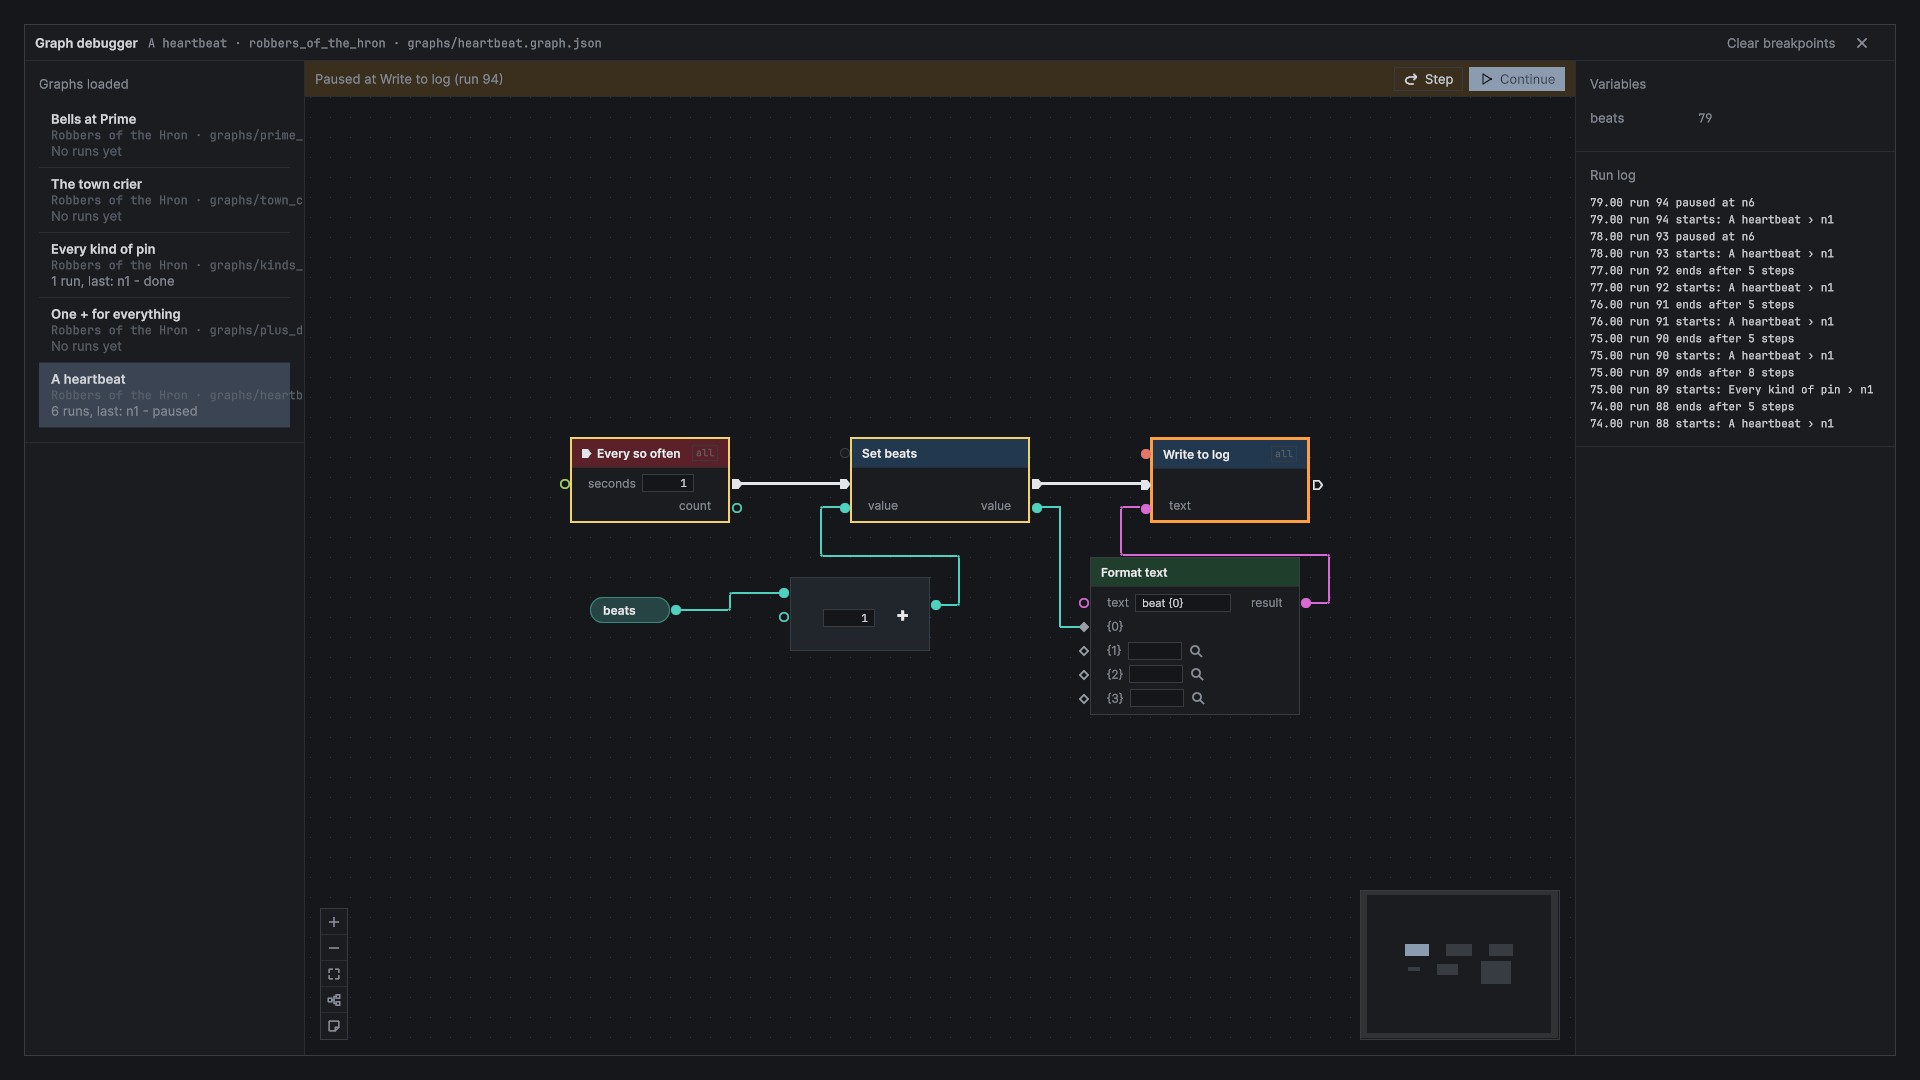
- Click the dot on a run node (an action or flow) to set a breakpoint. Inside a function's body, a breakpoint holds for every call of it.
- When a run reaches it, the run pauses there, its node outlined. A paused run waits as a Wait does; the game goes on.
- Read the run's variables on the right.
- Step goes to the next node; Continue runs on to the end or the next breakpoint.
When the debugger shuts, paused runs go on.
Other ways to see what a graph does
- Write to log puts a line in the game's log (at most 1,000 lines a graph).
- Check that tells a problem when what it is given doesn't hold: a mod's own test.
- Every problem a graph has, as it loads or while it runs, is listed under the mod on the Mods page.